Friday, December 30, 2011

What's the Purpose?

Last summer, the following tweet caught my attention:

"What's the purpose of school when all the content is available online? How do we make the time meaningful?"

These are worthy, powerful questions. What exactly is the value of public education in the instant-access world of our increasingly digital 21st century?

Here are a few of the high-impact skills and habits of mind that I believe we must teach and nurture in our classrooms (no matter what the content) so that our students can be successful and flexible lifelong learners:
  • how to access content efficiently using an array of digital tools (Google, Siri, YouTube, Wikipedia, etc.)
  • how to identify and access primary source content effectively (in science: NASA, NOAA, USGS, etc.)
  • how to produce compelling content in a variety of analog and digital formats (infographics, multimedia presentations, etc.) 
  • how to leverage creativity so that students can express their learning in meaningful and multi-faceted ways
  • how to think independently/interdependently so that students can ask their own questions and pursue their own interests
In this rapidly evolving world, we have no idea exactly what kinds of opportunities will be available to our students when they graduate. Our main focus should be helping students to become active producers of knowledge and value—not just passive consumers of information—so that they can become nimble and flexible contributors to society. Otherwise, we're probably irrelevant and detrimental to their future.

Let's strive to make 2012 relevant and meaningful for our students...

Saturday, December 24, 2011

Sunday, December 18, 2011

NASA Canceled the Space Program, Right?

NASA: The Blue Marble
Since the end of the shuttle program, my students have repeatedly expressed the notion that space exploration is done: "NASA canceled the space program, right?" While I know that's untrue, they do not — and that is very troubling (and eminently frustrating!).

In my classroom, I constantly use supplementary resources from NASA and other US government science organizations to help students understand that we are actively studying the Earth system, the solar system, and beyond every day. Earth science is not a collection of static facts and information, but is a dynamic and ever-evolving field of cutting-edge research. As educators, we need to help students make connections between what they are learning in the classroom and what is happening in the real world—it is not OK to just teach Earth science from a textbook. Like other scientists, NASA scientists are active explorers who continue to expand our knowledge of our own planet and beyond. The good news for us is that we can access a myriad of NASA resources right in the classroom and participate in the exploration:
  • NASA's main website is the logical starting point for the latest news and information about Earth and space. In addition to general information, the site has sections specifically for educators and for students with links to lessons, images, videos, podcasts, simulations, grants, scholarships, and more. We (often) complain about government, but NASA's website has got to be one of the best damn uses of taxpayer money out there.
  • NASA also has a huge variety of resources for iDevices at the NASA App Store. There are apps for exploring planets, finding out about the latest space missions, checking launch dates, and more. Oh, and all the apps are free. The NASA App HD for iPad is simply stunning.
  • Want the latest on climate? NASA's Global Climate Change provides real-time vital signs of our planet. My favorite parts of this site are the links to evidence, causes, effects, and uncertainties. Not only do you have the latest climate data at your fingertips, but the process of climate science itself is eloquently and transparently deconstructed and explained.
  • Need current events about planet Earth? NASA's Earth Observatory has fantastic articles, images of the day, global maps, and in-depth features about our home planet. Their weekly email digest is a must-have resource. Go subscribe today!
  • Need even more up-to-the-minute information? NASA has a fleet of Twitter accounts that provide the latest news from space explorers around the globe and beyond, including live tweets from robotic pioneers in space. A few of my favorites include NASAVoyager and NASAVoyager2, NASAJuno, and NewHorizons2015.
There are tons more NASA resources out there for students, educators, and the curious alike. We need not lament the demise of the space program; it is alive and well, even during these challenging socio-economic times. However, to keep the reality and promise of Earth and space exploration alive and thriving, we need to give our students every opportunity to learn about it and participate in it.

If there is any question about the urgency of science literacy in the 21st century, Stephen Colbert and Neil deGrasse Tyson spend an hour-and-a-half discussing the importance of science and technology in this thoroughly enjoyable video.

Saturday, December 10, 2011

Bathymetry in 3D

NOAA Portsmouth Harbor Bathymetry
Using depth data collected from sonar measurements, oceanographers create bathymetric charts showing physical features of the ocean floor. During our physical oceanography studies, students create both two-dimensional and three-dimensional bathymetric charts using depth data collected from "mystery boxes" containing models of various ocean features. During the lab activity, students complete the following tasks:
  • Collect depth data in rectangular grid patterns across the mystery boxes
  • Draw and colorize isobaths (lines of equal depth) to delineate areas of similar depth
  • Identify names of the ocean features found inside the mystery boxes
  • Create 3D surface charts from the data to finally "see" what's inside the mystery boxes
At the beginning of the lesson, students are rather daunted when I tell them they will be creating a 3D bathymetric chart. By the end of the lesson, they are quite proud of their accomplishments.

To create the final 3D bathymetric chart, students enter their data into Microsoft Excel and use the surface chart option to visualize a realistic model of their original mystery box. Just as we cannot lift the ocean to see the features below, students may never open the mystery boxes to see what's inside—they are reliant upon their data and 3D models to "see" the ocean floor.

The process for creating a 3D surface chart in Microsoft Excel (2007 and 2010 versions) is outlined as follows:
  1. Type in all of the bathymetry data (including grid numbers) and select it
  2. Go to Insert tab on the ribbon
  3. Click "Other Charts" and select "3D Surface Chart"
  4. Move Chart to "New Sheet"
  5. Right-click the vertical (value) axis and choose "Format Axis"
    • Change Maximum to "Fixed" and enter the maximum data value
    • Change Minimum to 0 (sea level)
    • Change Major Unit to "Fixed" and enter a value of 5.0 (the isobath interval)
    • Check the "Values in Reverse Order" box
    • Close
  6. Right-click the horizontal (category) axis and choose "Format Axis"
    • Check the "Categories in Reverse Order" box
    • Close
  7. Right-click the chart and choose "3-D Rotation"
    • Use the arrows and options to adjust the chart to a nice view
    • Close
  8. Click the entire legend ONCE to select it. Then click ONCE on an individual color in the legend to select it by itself.
    • Right-click that color and choose "Format Band"
    • Experiment with either the Solid Fill or the Gradient Fill to create a nice blend of colors from deep to shallow
    • Close
  9. Format the rest of the chart as necessary to include items such as a descriptive title, axis labels, and a well-written caption
  10. Add clip art and images to create a unique, eye-catching final style for the 3D chart
See the results below...


Saturday, December 3, 2011

Water, Water Everywhere...

Image credit: the MorgueFile
When studying the water cycle, three basic questions frame our learning:
  • Where is all the water?
  • How is the water distributed across planet Earth?
  • How does the water move through the Earth system?
Last week's post described data about global water distribution and techniques for graphing this data. The majority of water on planet Earth is contained in the oceans, bays, and seas (96.5%) with the rest of the water distributed (as either solid, liquid, or gas) among various fresh and saline reservoirs. Very little water is actually readily available for human use—an interesting point to discuss with students.

Water moves from reservoir to reservoir via various processes. There are numerous water cycle videos out there showing how water cycles around the planet. Almost any of these are good for helping students learn the basic terminology associated with the water cycle and visualizing how water moves. To take the learning deeper and go beyond simple rote memorization, I add a few more pieces to the water cycle puzzle.

Water Cycle Simulation Tank

Materials and ingredients:
  • an aquarium tank
  • wooden blocks
  • various rocks and pebbles
  • greenery (a few cuttings from house plants)
  • water (of course)
  • two thermometers
  • extra wide roll of aluminum foil
  • a glue gun
  • tape
  • two nested, quart-sized plastic zipper bags
  • ice
  • a pie plate
  • an adjustable lamp
Recipe:
  1. Set up the aquarium on a stable surface using wooden blocks underneath one end to angle the aquarium.
  2. Arrange the rocks and pebbles to represent land on the higher side of the aquarium and tuck in the greenery.
  3. Add a liter or so of water to the lower end to simulate the ocean.
  4. Place the two thermometers inside the tank, one on the land, one in the sea.
  5. Prepare two layers of aluminum foil for covering the aquarium, and add several dots from the glue gun to the underside of the aluminum foil that will be covering the land. These dots serve as condensation nuclei for the water vapor that will evaporate from the ocean inside the tank.
  6. Cover the tank with the foil and seal with tape so that the tank is a closed system.
  7. Fill the inner plastic bag with ice and seal, and seal the outer bag as well (minimizes leakage). Place the ice bags in a pie pan (a redundant leakage collector) on top of the aluminum foil so that they sit over the land side of the tank. The ice promotes condensation and precipitation.
  8. Place the lamp on the water side of the tank so that it warms the water and drives evaporation.
  9. Commence water cycling!
Water Cycle Simulation Tank
I usually set this up a day ahead of time and allow students to ponder what its purpose is. Soon, I overhear observations about radiation from the lamp, evaporation, condensation, raindrops collecting on the glue drops above the land, precipitation falling onto the leaves of the greenery, etc. Without much prompting other than "What do you think is happening?" students figure out the water cycle process pretty quickly on their own.

Water Cycle Diagrams

Both NOAA and USGS have some beautiful water cycle diagrams that can be used to match water cycle vocabulary to water cycle processes. These are good for students to work with during water cycle videos.

Water Cycle Research

Beyond the textbook basics, how do we continue to study the water cycle today? Is it constant or is it changing over time? What tools and technology do we use? To help students better understand current water cycle research, I tap into resources and data visualizations produced by NASA. Here are a few:
  • NASA's Earth Observatory has an excellent, detailed discussion of the water cycle from the basics to current observations and research
  • NASA's Molecule Max is a whimsical and informative video tutorial on how Earth's water cycle works and how NASA studies it using satellites in space
  • NASA's Science Visualization Studio produces a number of high-resolution, global animations of various components of the water cycle
The water cycle is more than just a bunch of memorizable vocabulary terms. It is a dynamic Earth system process worthy of in-depth study and appreciation, especially as natural and anthropogenic forces strain and threaten our precious water resources.

Friday, November 25, 2011

Science Data Exploration

Earth as a system,
from Investigating Earth Systems
Learning about the Earth as a system provides a wide range of opportunities for students to explore various sets of data to better understand the individual components — the atmosphere, the hydrosphere, the geosphere, the biosphere — and how they are interconnected. Throughout our study of Earth science, I give students multiple occasions to interpret, analyze, and evaluate various Earth system data. Over the years, I've built up a collection of simple, useful datasets for students to manipulate using graphing software such as Microsoft Excel, Create A Graph, or Google Spreadsheet. Here is a sampling of some of these data.


The Atmosphere

Each year, we begin our study of the Earth system within the atmosphere—the gaseous envelope surrounding our planet which has evolved from and interacts with the other "spheres" of the Earth system. Investigating the composition of Earth's atmosphere is thus a logical first step in our data exploration.

Composition of Earth's Atmosphere
Data source: Wallace, J.M. and Hobbs, P.V., 1977, Atmospheric Science—An Introductory Survey

Compound Percent
Nitrogen 78.08
Oxygen 20.95
Argon 0.93
Trace Gases 0.04

It is useful to refer back to this set of data often during our climate studies, reminding students that the tiny fraction of trace gases are responsible for the greenhouse effect and instrumental in maintaining the balance in Earth's energy budget.


The Hydrosphere 

As we move from the atmosphere to the hydrosphere, students explore how water is distributed across our planet as well as examine the composition of ocean water. When examining global water distribution, it is useful to have students consider how much of this water is readily available for daily human use. Additionally, this set of data provides an opportunity for students to learn how to create "pie-of-pie" graphs to best show data that has a large range of values.

Global Water Distribution
Data source: Gleick, P. H., 1996, Water resources. In Encyclopedia of Climate and Weather, ed. by S. H. Schneider, Oxford University Press, New York, vol. 2, pp. 817-823

Water Source Percent
Oceans, Seas, and Bays 96.5
Ice Caps, Glaciers, and Permanent Snow 1.74
Groundwater (fresh) 0.76
Groundwater (saline) 0.94
Soil Moisture 0.001
Ground Ice and Permafrost 0.022
Lakes (fresh) 0.007
Lakes (saline) 0.006
Atmosphere 0.001
Swamp Water 0.0008
Rivers 0.0002
Biological Water 0.0001


"Have you ever had a mouthful of ocean water?" is a great question to ask students when introducing the next set of data. It elicits an immediate "Ewww!" response and primes students to think about the compounds contained in that mouthful of water and how they got there.

Composition of Ocean Water
Data source: National Science Teachers Association, 1992, Project Earth Science, Physical Oceanography

Element Percent
Oxygen 85.7
Hydrogen 10.8
Chlorine 1.9
Sodium 1.05
Magnesium 0.135
Sulfur 0.0885
Calcium 0.04
Potassium 0.038
Bromine 0.0065
Carbon 0.0028
Other 0.001


The Geosphere 

When we transition to our studies of the geosphere, students take a look at data comprising the Earth's crust. The composition of Earth's crust shows many commonalities with the composition of ocean water data above. It is useful to have students compare and contrast the two sets of data. It is quite a challenging discussion when students are asked to explain how the Earth's crust can be nearly 50% oxygen; it helps reinforce the meaning of "compound."

Composition of Earth's Crust
Data source: Glencoe Earth Science, 1999

Element Percent
Oxygen 46.6
Silicon 27.7
Aluminum 8.1
Iron 5.0
Calcium 3.6
Sodium 2.8
Potassium 2.6
Magnesium 2.1
Other 1.5


The Solar System 

Finally, as we move from the safety of our home planet and journey into the rest of the solar system, it is interesting to ponder the composition of the solar system itself. Once again, it is useful to compare and contrast the similarities and differences among the various sets of data ("What's up with all that hydrogen?"). It is also interesting to ponder how knowledge of Earth's composition can help scientists understand and make sense of the compositions of other objects in our solar system.

Composition of the Solar System
Data source: Mineral Information Institute, Golden CO, 2002, http://www.mii.org

Element Percent
Hydrogen 91.04
Helium 8.81
Oxygen 0.08
Carbon 0.03
Neon 0.01
Nitrogen 0.01
Magnesium 0.004
Silicon 0.003
Iron 0.003


With an endless variety of Earth system data available, students have many opportunities to deeply engage in scientific analysis and interpretation as well as develop an appreciation for the Earth as an interconnected system. If you use other interesting datasets, please feel free to share them in the comments...

Saturday, November 19, 2011

My Thanks

For enriching my life as a scientist and educator, I am eternally grateful…
  • NASA, NOAA, and USGS — for providing invaluable science resources
  • NSTA — for championing scientific literacy
  • Free and open internet — for democratizing information access
  • My science heroes — for inspiring me with your words
  • My teaching colleagues — for being courageous allies and supportive friends
  • My students — for nurturing the planet and seeking to understand the universe
Happy Thanksgiving to all!

Saturday, November 12, 2011

Global Climate Change Article Analysis

Image credit: IAN Symbol Libraries
To finish our annual study of global climate change, I ask students to survey a variety of scientific literature outlining the impacts of climate change around the world and to interpret their findings. Students need the opportunity to engage with the scientific literature around global climate change in order to develop their own sense of climate science literacy. The US Global Change Research Program sums up the importance of climate literacy in the following guide, Climate Literacy—The Essential Principles of Climate Sciences:

"Climate Science Literacy is an understanding of your influence on climate and climate’s influence on you and society. A climate-literate person:
  • understands the essential principles of Earth’s climate system,
  • knows how to assess scientifically credible information about climate,
  • communicates about climate and climate change in a meaningful way, and
  • is able to make informed and responsible decisions with regard to actions that may affect climate."
I provide students with a wide sampling of scientific articles that document climate change and climate change impacts from around the world. Each student selects, reads, and summarizes the main scientific ideas from several of these articles, then chooses one article to interpret in more detail. In the final analysis, students create a labeled diagram that illustrates the main scientific ideas from their chosen article and explains the connection between the science and the climate change impacts.

For most students, this is the first time they have engaged in a formal literature review of scientific material, thus time and support is provided to help students dissect these articles efficiently. At our school we use a Mark-It-Up reading strategy, which helps students break down complex texts into the comprehensible essentials. Students write their "mark-it-up" notes on stickies and place these stickies around the room next to their article's placard. All students visit and review the stickies created by other students before drafting their final analysis.

For the articles themselves, I keep my eyes open for timely and relevant stories from reputable and fairly unbiased science sources such as BBC Science, National Geographic, NPR, NOAA, NASA, etc. The articles are usually no more than two pages in length, span a range of teenage reading levels, are scientifically-based with data and evidence, and encompass a wide range of climate impacts around the planet. A few of these articles are provided in the links at the end of this post.

As mentioned in my previous post, my greatest hope is that my students develop an appreciation for science so that they can make logical and informed decisions based on data and evidence, not hype and hot air.


A Sampling of Climate Change Articles:

Saturday, November 5, 2011

Global Climate Change 101

One of the most troubling aspects of the global climate change "debate" is how poorly those who deny climate change understand the basic physics and chemistry of Earth's atmosphere. As we study global climate and climate change in the classroom each year, I strive to help students understand the basic scientific principles of Earth's atmosphere first, then present students with the opportunity to work with some of the global climate data. My students are afforded the privilege to develop their own conclusions about global climate change based on the data and evidence that scientists have collected.
The Greenhouse Gases

Our study of climate change begins with a look at the greenhouse gases and the greenhouse effect. When first asked, students unsurprisingly respond that the greenhouse effect is a "bad thing," exhibiting their imperfectly developed understanding of this natural phenomenon. I must often confront this and other types of misconceptions in my science classroom, thanks mainly to the disinformation that students have been exposed to through television media.

The greenhouse effect refers to the ability of Earth's atmosphere to retain additional heat energy because of the presence of various greenhouse gases, such as water vapor and carbon dioxide. The greenhouse effect is a wholly natural phenomenon; without it, Earth's average temperature would be 33°C lower than it is now, and the planet would be completely frozen. No greenhouse effect means no liquid water, which means no plants, which means no life.

So, this natural greenhouse effect is truly a good thing for our planet. But what happens when the greenhouse effect is altered, by adding additional greenhouse gases to Earth's atmosphere? Any change in the composition of Earth's atmosphere will alter its chemistry and add imbalance to Earth's energy budget. (Earth's energy budget is a balance of energy: solar energy from the Sun flows into Earth's atmosphere, is converted to infrared heat energy by the atmosphere, clouds, and surface of the Earth, which eventually flows back into space.) The Earth system will respond to changes in atmospheric chemistry through a variety of feedback mechanisms, but ultimately the physics dictates that increased greenhouse gases create a warmer planet.

There are four major, naturally-occurring greenhouse gases in Earth's atmosphere: water vapor, carbon dioxide, methane, and nitrous oxide. As mentioned above, these gases help create a favorable temperature on our planet. However, since the beginning of the Industrial Revolution back in the 1700's, humans have been adding more of these gases plus a host of new, synthetic gases to the atmospheric mix. The concentrations of almost all of these gases have been rising steadily for the past 200+ years.

Why are these invisible, colorless, odorless gases called "greenhouse gases?" What do they actually do in the atmosphere? This is an abstract concept for students to grasp, but it is imperative that they understand how these greenhouse gases behave to appreciate their role in maintaining an atmospheric heat balance. One excellent tool is the Greenhouse Effect simulation, part of the PhET collection developed by the University of Colorado. In this interactive simulation, students can see what happens when both solar energy from the Sun and infrared heat energy from the Earth interact with various gaseous molecules present in Earth's atmosphere. Molecules such as nitrogen and oxygen—the two most abundant molecules in Earth's atmosphere—allow both solar and infrared energy to pass through the atmosphere uninterrupted. In contrast, greenhouse gas molecules such as carbon dioxide and methane allow the solar energy to pass into the Earth's atmosphere freely, but disrupt the return flow of infrared energy back into space. Because of the greenhouse gases, the heat energy leaving planet Earth takes longer to return to space, thus warming the planet.

What data do we have to support and validate the phenomenon of the greenhouse effect? For the past 50 years, NOAA scientists have been collecting air samples all around the globe and measuring the concentrations of different greenhouse gases in our atmosphere. The concentrations are steadily increasing as humans add more of these gases into the atmosphere through the burning of fossil fuels and the release of gases through various industrial and agricultural processes. NOAA developed a simplified measure of the combined effects of these gases, the Annual Greenhouse Gas Index (AGGI). The AGGI provides mathematical values for each of the greenhouse gases that indicate their individual contribution to the greenhouse effect and the warming of our planet. My students graph the AGGI data each year and draw conclusions about the patterns and trends in the data. SPOILER ALERT: The data support greenhouse theory.

The approach to which I introduce students to global climate change is entirely evidence based. For any scientist to make claims or propose hypotheses about the natural universe (including planet Earth) requires that she or he follow the evidence trail. An overwhelming body of evidence, including laboratory testing, supports scientists' explanations about the greenhouse effect, the changes to the greenhouse balance, and its impacts on global climate. To ignore both the evidence and the rigorous science behind it presents a moral and ethical dilemma that I believe is irresponsible to the inhabitants of this planet—our only home in the universe. My greatest hope is that my students develop an appreciation for science so that they can make logical and informed decisions based on data and evidence, not hype and hot air.


Classroom resources for global climate change studies:

Sunday, October 30, 2011

Colorado Weather Diagrams

Colorado Weather Diagram
This week, students created Colorado weather diagrams in order to think more deeply about significant weather events and what must be done to prepare for these events. The lesson also provided an opportunity to talk about using primary resources when conducting scientific research. Not surprisingly, with this week's early-season snowstorm, many students chose winter storms as their primary research focus—although tornadoes are always popular, too.

Here are the guidelines for the lesson:
Pick one Colorado weather event to research in more detail. Use the primary resources on our science website and the materials (primary resources, posters, textbooks, etc.) in the classroom for your research. Create a labeled and illustrated diagram about your event, and include the following information:
  • What are the necessary ingredients for this type of weather event?
  • How/why/when/where does this weather event occur?
  • What are the hazards and impacts of this event on humans? 
  • What are some good safety preparations and guidelines for this type of weather event?
  • Don’t forget descriptive title, caption, color, etc...
Use the space on the paper to organize your notes and create a rough draft. Your final draft goes on a separate sheet of paper.
There are several reasons that I like this lesson:
  • It reviews/reinforces the concept of using primary resources when conducting scientific research. We get a chance to discuss the appropriate use of resources such as Wikipedia and textbooks, and the benefits of getting as close to the primary source as possible when engaging in scientific research. In the case of severe weather, NOAA and the National Weather Service are definitely excellent primary resources. A list of the guides we used appears at the end of this post.
  • The research questions are multidimensional, covering both the mechanics of weather and its impacts on human beings. Students complain that sometimes their favorite TV shows are interrupted by severe weather warnings—this lesson helps them understand and appreciate the necessity of these interruptions and the potential life savings that occur because of them.
  • There is room for creative expression. The more I teach, the less I specify how a particular assignment should be presented by students. I speak in terms of generalities: a well-designed diagram with appropriate communication elements such as title, caption, labels, arrows, color, etc. Our classroom standard of excellence is that students may be as creative as they wish, but they cannot distort, exaggerate, or dilute the scientific data; and, their presentation must be such that an intelligent stranger would fully understand their work without being confused or needing to ask basic questions such as "What is this?" or "What does this mean?"
  • Students are expected to rough draft and peer edit their work, which emulates the peer review process in science.


Here are links to the primary resources used in this lesson:

NOAA Safety and Awareness Publications, Brochures, Booklets for Children and Adults

NOAA Preparedness Guides:

NOAA Owlie Skywarn Guides:

Saturday, October 22, 2011

In Defense of Hands-On Science

Investigating Rates of Heating and Cooling
"The debate over how best to teach science has amplified as school districts and states place more emphasis on standardized testing." —David Klahr, professor of psychology at Carnegie Mellon University in Pittsburgh

In a Palm Beach Post article, middle school science teachers in a Florida school have discarded hands-on science learning activities in favor of demonstrations, videos, PowerPoint lectures, and other direct instruction techniques. Their argument is that lengthy, hands-on science investigations do not translate into significantly positive gains on state standardized tests. As a scientist and educator, I am disturbed and unsettled by this decision to sacrifice a vital component of the process of science in the name of test scores.

Two years ago, our school district adopted a curriculum that promotes inquiry-based learning as an essential component of our students' science education. This inquiry focus is derived from the National Science Education Standards:
Scientific inquiry refers to the diverse ways in which scientists study the natural world and propose explanations based on the evidence derived from their work. Inquiry also refers to the activities of students in which they develop knowledge and understanding of scientific ideas, as well as an understanding of how scientists study the natural world. [National Research Council. 1996. National Science Education Standards. Washington, DC: National Academy Press.]
In addition to an inquiry focus, our curriculum strives to teach for enduring understanding, whereby students make mindful meaning of their learning as well as transfer their learning to new situations or problems; simple knowledge acquisition is insufficient. To achieve this worthy goal, which ultimately benefits students and society, requires a commitment to creating an environment where the process of science is paramount, where our students are engaged in authentic, hands-on learning.

In my opinion, taking away hands-on learning opportunities denies students access to a rich, quality scientific education experience. It prioritizes extrinsically-driven, short-term knowledge acquisition and test score gains over intrinsically-motivated, deep understanding and lifelong learning. I choose depth of understanding over breadth of knowledge—a depth developed through student engagement in well-designed, meaningful, time-worthy (not time-wasting), hands-on laboratory investigations.

The debate on how best to teach science will continue, but I hope that a rational commitment to authentic, inquiry-based science education—which includes hands-on investigations—survives the pressures of high stakes testing.

Saturday, October 15, 2011

Meteorology Questions

Image Credit: Pics4Learning
I frame our science learning in terms of questions—learning goals, laboratory research questions, daily warm-up questions, one-on-one student conversations, etc. Questions stimulate thinking and conversation; the more questions, the better. I am famously known for never giving students "the right answer," but always asking them that one additional question. Of course, my favorite question is, "Why?"  :)

Throughout the school year, I will share some of the questions we ponder as we engage in the process of science. Here is a sampling of some of the "big idea" questions that I pose during our study of meteorology:

Atmospheric Structure
  • What are the features and characteristics of Earth's atmosphere?
  • What is the composition of Earth's atmosphere?

Heat Transfer
  • How is heat transferred in Earths's atmosphere?
  • What are the three types of heat transfer in Earth's atmosphere, and how does each work?
  • What is Earth's energy budget?

Weather Maps
  • How do scientists measure, record, and analyze various types of weather data?
  • How do we measure air temperature?
  • How do we measure dewpoint and humidity?
  • How do we measure atmospheric pressure?
  • How do we measure wind direction and wind speed?
  • How do we draw isobars?
  • What are fronts and how do we locate them on a weather map?

Types of Weather
  • What causes weather?
  • How are clouds formed?
  • How do scientists forecast the weather?
  • How do different types of severe weather form?
  • How do scientists monitor severe weather? 
  • How do we prepare for and stay safe during severe weather?

Climate Change
  • How do scientists study global climate and climate change?
  • What are the factors affecting climate change over time?
  • What is the greenhouse effect and how does it work?
  • How do we measure "parts per million?"
  • How does carbon cycle through the Earth system over time?
  • What is our current understanding of climate change?


For more information about effective questioning:
Ivan Hannel, Insufficient Questioning, Phi Delta Kappan, Vol. 91, No. 3, November 2009, pp. 65-69. In this article, author Ivan Hannel discusses how highly effective questioning can keep students interested and improve their learning.

Saturday, October 8, 2011

Thanks for Being Insanely Great

Steve Jobs is one of my heroes.

Credit: Jonathan Mak
Steve's genius and vision has touched my life for more than a quarter century. He brought us the best damn pieces of technology on the planet, and disguised them as works of art. He breathed joy and wonder into otherwise dull, utilitarian objects. When I imagine a world without Steve Jobs, I see a world where technology lacks heart and soul — a DOS-colored landscape of intolerable digital devices moldering in the dusty recesses of our lives.

I cannot help but smile when I reflect on the influence of Steve Jobs and Apple in my classroom. The attention to detail and the audacity to "Think Different" have made huge, positive impacts on my students:

  • Grape iMac = coolest, most enticing computer ever
  • Stickies = most elegant, colorful, and simple text display utility
  • Keynote + beautiful fonts + stunning transitions and animations = rapt audience
  • iTunes + iPod = musical therapy
  • iPad + NASA = wow!

Thank you, Steve, for being insanely great…

Saturday, October 1, 2011

What Is Excellent?

While I recognize their utility and purpose, I've never been a big fan of rubrics. So time-consuming to create, and all those "less than proficient/unsatisfactory" categories that aren't even appropriate for students to consider. Back in 2009, I attended a presentation by Rick Wormeli—author of Fair Isn't Always Equal—in which he advocated the use of a much simplified, more holistic Standard of Excellence over the traditional, multi-column rubric. What a relief to discover a more flexible alternative to the perennially rigid rubric! In a Standard of Excellence guide, only the highest standards are defined and presented to students. Gone are all those mediocre and meaningless categories, such as "proficient," "adequate," "poor," etc. (To paraphrase Mr. Wormeli, "Do you really want your students to settle for being mediocre?")

Image credit: Discovery Clip Art Gallery
What does this look like in my science classroom? I have a collection of help guides that students use over and over throughout the year, and these guides define the standard of excellence: this is what an excellent graph looks like, this is what an excellent data table looks like, this is what an excellent masterpiece caption looks like. No confusion, no waffling. It's so much simpler to say to students, "Your work is not done until you have addressed every item in our Standard of Excellence." I find that students generally strive to achieve the defined level of excellence—they want to do well.

A key to successful application of this model is clearly defining what the standard of excellence looks like and regularly asking students if they have met that standard. I teach my students to self-assess their own learning against the standard before asking me to check their work. I can modify the standard for students with different needs by having them focus on particular items within the standard, rather than just watering down the whole standard.

While good rubrics have their rightful place in education, they are no panacea. We must be careful when applying rubrics to our students—no single rubric can quantify the learning styles of the children we teach. Over-reliance on rubrics can stifle the intrinsic creativity and thirst for discovery our students possess.


Excellent Sample Guides

Additional Reading

Saturday, September 24, 2011

Teacher Notes

Once upon a time, the thought of creating a huge lesson plan replete with extensive teacher notes was overwhelming to me. Notes were sacrificed in favor of developing and copying actual classroom activities. What I didn't realize as a novice teacher was that a simple text editor (like TextEdit, NotePad, or Google Docs) could be the perfect tool for creating detailed teacher notes with relative ease.

The trick to great teacher notes is not to try to write them before a lesson, but to write them as the lesson unfolds. Sure, you need to have a rough outline of learning goals, activities, assessments, etc. before you run the actual lesson, but trying to write down every tiny detail beforehand is impossible and stressful.

This is where the simple text editor comes to the rescue. On the day(s) of the lesson, have the text editor open on your computer. Use it to make notes throughout the course of your day as the lesson unfolds class by class. Don't worry about fancy editing—this is a simple text document. You want to capture the rich flow of information from your classroom as it happens "live." By the end of the day, you will have a wealth of information about the lesson that you never thought possible, including questions you asked, questions students asked, materials/resources you used, things that worked well, things that need to be tweaked/changes, things to remember for next year.

Capture every moment that you can (when you can) during class and add it to the text editor. Doesn't matter if they are quick little jots… Doesn't matter if you miss a few things… Doesn't matter if they are free-form and disorganized… The point is the process. If you've thought that creating teacher notes for your lessons is an impossible task, this method will make the process much simpler and much more organic.

Save these notes from year to year, organize them as you go along, and update them as you reteach a lesson. Keep a list of which file of notes goes with which lesson in a table document. Before you know it, you will have a rich history of your personal teaching expertise (which you might someday share with the rest of the world).


SAMPLE SCIENCE SAFETY LAB NOTES

Learning Goal: What are the safety expectations in science?

Science Safety Contracts

  • what should the safety rules for our science classroom be?
  • have students brainstorm their top 3 science safety rules and share
  • type shared responses on big screen
  • hand out and go over Science Safety Contracts 
  • have students take quick Science Safety Quiz 
  • have students sign class safety contract sheet
  • show "Carol" safety poster and discuss
  • collect class safety contract signature sheets
  • homework: parent signature on safety contracts

Saturday, September 17, 2011

The Power of Inquiry

There were less than five minutes left in class, yet three students asked me if they could use Excel to create a graph from their experimental data. Many other students would have looked at the clock and begun stealthily packing up their binders for the day, but these students wanted to graph their results. My answer was a no-brainer, "Go for it! You can do it!" And in those few remaining minutes they worked up an excellent pie graph showing their results.

Investigating the Rates
of Heating and Cooling
This is the kind of awesome, independent learning that makes my day. I promote an inquiry-based classroom where students are in charge of their destiny. I do not spoon-feed answers to my students, but challenge them to forge their own paths of learning and take charge of their own education. To me, creating and encouraging independent learners is the noblest goal of any teacher. Teachers as facilitators and cheerleaders, who provide the resources and scaffolds to enable students to blaze their own trail.

I was so proud of these three students that day. They epitomized all that great learning should be in every classroom, every day.

Some students and parents may balk at my approach. "Why won't you just tell me the answer?" is an oft-heard question, especially in the beginning of each school year. But slowly, with encouragement and cajoling, I wean students off their dependence on quick, easy answers in favor of deeper thinking, problem-solving, and meaningful learning. I realize I may not be every student's favorite teacher at that moment when I ask them to do and think for themselves, but given our challenging times and complex world, how could I expect less?

The National Science Education Standards (1996) define the fundamental abilities of inquiry as follows:
  • Identify questions that can be answered through scientific investigations.
  • Design and conduct a scientific investigation.
  • Use appropriate tools and techniques to gather, analyze, and interpret data.
  • Develop descriptions, explanations, predictions, and models using evidence.
  • Think critically and logically to make the relationships between evidence and explanations.
  • Recognize and analyze alternative explanations and predictions.
  • Communicate scientific procedures and explanations.
  • Use mathematics in all aspects of scientific inquiry.

In its official position statement on scientific inquiry, the National Science Teachers Association "recommends that all K–16 teachers embrace scientific inquiry and is committed to helping educators make it the centerpiece of the science classroom. The use of scientific inquiry will help ensure that students develop a deep understanding of science and scientific inquiry."

These are the standards toward which I strive...

Sunday, September 11, 2011

Analyzing Local Weather Data

These days, there are numerous sources and tools on the internet that provide access to live weather data, which can be used to practice and refine data interpretation skills. In our school district, data interpretation is one of the essential middle level science learnings:
"Students can interpret, analyze, and evaluate data and recognize bias in order to formulate logical conclusions."
ASOS: the National Weather Service's
automated weather observing network
The National Weather Service provides a plethora of weather data that is ideal for use in the classroom. In my last post, I talked about hurricane data. In this post, I'd like to explore local weather data.

On a daily, monthly, and yearly basis, the National Weather Service records and archives basic weather data such as temperature, pressure, wind, precipitation, etc. In most places across the United States, there is more than 100 years worth of data in the climate archives—all of this data is accessible online. This data can be used in the classroom to analyze local patterns and trends.

To access the National Weather Service climate data:

  1. Go to http://www.weather.gov
  2. Type your zip code into the Local Forecast box in the top left corner
  3. On the next page, select the link to your local National Weather Service office in the top left corner—it looks like "NWS Denver-Boulder CO"
  4. On the next page, look for the Climate section along the left panel and select the Local link. 

From here, you and your students have access to all of the local climate data and records. One of the reports I use with my students is the "Climatological Summary Month-to-Date," which provides a table of the current month's daily weather statistics. Each day during one month, we start our science class by pulling up this page and recording the previous day's high temperature, low temperature, and precipitation in our own data tables. At the end of the month, we graph, summarize, and analyze the data. Students reflect on the following questions:

  • What was the average high temperature for the month?
  • What was the average low temperature for the month?
  • What was the total precipitation for the month?
  • How much warmer or colder than normal was this month?
  • How much wetter or drier than normal was this month?
  • Based on the data, how would you summarize this month's weather?
  • Were there any notable or unusual weather events this month?
  • Were there any record weather events this month?

We should seek every opportunity to bring authentic data into the classroom to promote scientific literacy and help students make real world connections. One of my favorite quotes that bears repeating (often):
"If you're scientifically literate, the world looks very different to you, and that understanding empowers you..." —Neil deGrasse Tyson, Astrophysicist
The National Weather Service is but one of the many science organizations that publishes useful data online. I will discuss others in future posts...

Sunday, September 4, 2011

Data Interpretation and Hurricane Tracking

Hurricane season always provides an authentic opportunity to learn about the process of science. These days, there are numerous sources and tools on the internet that provide access to live weather data, which can be used to practice and refine data interpretation skills. In our school district, data interpretation is one of the essential middle level science learnings:
"Students can interpret, analyze, and evaluate data and recognize bias in order to formulate logical conclusions."
This past week, Hurricane Irene struck the eastern United States, causing major flooding and destruction in many areas. A plethora of science instruments—land-based, sea-based, plane-based, and satellite-based—monitored Irene's vital signs as it trekked across the planet and affected millions of humans. These instruments captured a wealth of data and images that can be used in the classroom to help students better understand hurricanes as well as reinforce how science works.

Hurricane Irene, Doppler Radar Animation,
courtesy of the Weather Underground
Precipitation data from land-based Doppler radars is one of the types of information collected during a hurricane. Doppler radars produce colorful images and animations that can be used to stimulate student conversations about science—sort of a digital dissection. During Hurricane Irene, I captured a Doppler radar animation centered around the hours when the cyclone first made landfall on the outer banks of North Carolina (click the image to the right to view the animation). The animation loop provides enough information to discuss and infer basic weather variables such as tropical cyclone circulation, forward storm motion, wind speed, wind direction, precipitation rates and amounts, and more. (Details for capturing a Doppler animation loop are at the end of this post.)

When using images and animations, I ask students three main questions:
  1. What do you see? (observations) 
  2. How do you know? (evidence) 
  3. What can you infer? (interpretation) 
I have students practice the "What do you see?" and "How do you know?" questions first as small table groups, then share the "What can you infer?" question as a whole class. During the table discussions, I circulate around the classroom as a background observer and facilitator—listening to their conversations, asking clarifying questions, and nudging everyone in the group to participate equitably. There are no right or wrong answers during these small table discussions; it is an opportunity for students to hone their science skills. This activity empowers students to have authentic peer conversations about real science data, a basic "process of science" principle. Additionally, this activity allows students to practice their powers of observation and interpretation together in preparation for hands-on lab experiments in which they will need to collect and interpret their own data.


Capturing a Doppler Animation Loop

There are numerous sources of weather information on the internet, but my favorite is the Weather Underground. Their maps, graphics, and animations are well-designed, easy-to-read, colorful, accessible, and appropriately scientific, which makes them an ideal source for the science classroom.

To capture a Doppler animation loop, do the following:
  • Go to the Weather Underground website, and of course bookmark/favorite it for future use.
  • Select the Radar link under the Maps & Radar tab on the main page.
  • Select one of the Doppler radar sites (indicated by + symbols) closest to the area of interest.
  • To generate an animated loop on the radar page, adjust the Radar Controls on the right side of the page, then click the Update Radar Map button. For Hurricane Irene, I modified the Animate Frames box to 40, and the Frame Delay to medium, while leaving the other options at their default settings.
  • Once the full animation loads, select the View/Save This Image link at the bottom of the loop to display the animation on a separate web page. Then, save a copy of the animation to your computer (usually File-->Save As…). This animation can be replayed on your favorite web browser for later classroom use.

Saturday, August 27, 2011

Science Safety

Image credit: Morgue File
One of the unique aspects of the science classroom is safety. A good science teacher prioritizes and actively models safe behavior for her or his students at all times. To do otherwise is negligent.

Before every lab activity, students and I spend time reviewing the safety considerations and expectations, no matter how minor or seemingly trivial. Behind the scenes, I am checking, maintaining, and calibrating science equipment before and after labs, conducting annual chemical inventories and chemical storage reviews, and keeping up-to-date on science safety news and information. The last thing I want in my classroom is an accident caused by unsafe behavior; therefore, safety is always our #1 priority.  

Flinn Scientific is a great resource for science classroom safety, as well as being a wonderful source for science materials and equipment. They offer a wide range of free science safety resources including training videos, printable MSDS documents, chemical storage guidelines, safety contracts, and more. Whether you are a brand new or veteran science teacher, the safety resources from Flinn are worthy of your time.

For years now, we have been using Flinn's Science Safety Contract in our school. Offered in both English and Spanish, this contract is comprehensive, logical, and easy-to-understand for middle schoolers. All students and parents must sign this contract before being permitted to participate in any science lab activities.

In addition to getting familiar with the safety contract, I have students create a safety diagram of the science classroom. This activity gives students the chance to locate every safety feature in and near the science classroom, thus giving them ownership for our collective safety. We brainstorm and discuss the purpose and operation of each safety feature, and demonstrate a few of the items along the way. To be considered excellent, students' safety diagrams must be clearly labelled, be simple enough for any child in our K-8 school to use, and include standard diagram elements such as a descriptive title, a masterpiece caption, a key, a compass rose, and appropriate colors to distinguish items.

My commitment to science safety is captured quite pointedly on a poster I have in my classroom. In stark black and white, the poster shows the silhouette of a young woman using a blind walking cane. The caption reads, "Carol never wore her safety goggles. Now she doesn't need them." The message to students is crystal clear…

Saturday, August 20, 2011

Connect the Dots

One of the challenges facing educators is helping students connect the dots among disparate pieces of the learning puzzle in order to see the "big picture." Our goal is to help students transfer understanding from topic-to-topic, lesson-to-lesson, concept-to-concept, domain-to-domain, in order to better appreciate how everything works together. The struggle is valiant and the rewards are great.

I particularly enjoy helping my science students connect the dots between different disciplines, such as science and math. Inevitably, I get the question, "Why do we have to do math in science?" I convey to my students that there are underlying, powerful, natural connections between different learning disciplines such as math and science, and proceed to illuminate those connections. I believe it is incumbent upon educators to assure students that we don't just make this stuff up or create rules out of thin air—that the interdisciplinary connections are real and have a noble purpose.
Pink and Green Polka Dot Background by annnie

An example of these connections can be found within the concepts of independent and dependent variables, which can be quite abstract, dreadfully boring, and quickly forgotten if just memorized. So how do we help these concepts better stick (transfer) in the student mind? Play connect-the-dots!

I've done this in my science classroom as follows: I frame all experiments and all discussions of research questions, data tables, and graphs entirely in terms of independent and dependent variables; constantly reinforce; and never waver...
  • Write research questions in the form of, "How does _____ affect _____ ?" where "How does (the independent variable) affect (the dependent variable)?" becomes our standard template.
  • Construct data tables where x (the independent variable) is the first column of data and y (the dependent variable) is the second column of data. (Subsequent columns of data are y1, y2, y3, etc.)
  • Create graphs where the x-axis shows the independent variable and the y-axis shows the dependent variable.
  • Constantly ask students, "Which variable depends on the other?" because "y depends on x." Purposely create false (and silly) combinations to help students make the distinction: "Does the height of the mountains depend on the air temperature? Wouldn't that look funny to see the mountains go up and down as the temperature changed?"
    Using the same structure of common language (and clever examples) across grade levels and between disciplines such as math and science helps students create deep, transferable connections of understanding.

    If you are interested in a printable copy of Connect the Dots for your classroom, visit here.

    Sunday, August 14, 2011

    Collaboration -- A Hero's Journey

    This year, our school district launches Collaboration Time for Teachers, a weekly opportunity for teachers to have additional time during the school day to work together and have professional conversations. Our district and schools spent much time last year hammering out the fine points of what this collaboration time would entail, mainly defining "the vision" and "the details." During many a meeting in which "the details" necessarily took priority, 'the vision" became buried and forgotten. I felt that it was vitally important that "the vision" not be lost.

    The Hero's Journey
    Asked by my principal to reflect on "the vision" of collaboration and share my thoughts with our staff, I gladly accepted the opportunity to re-clarify this vision. Here is a summary of my thoughts:

    Our school was founded 12 years ago with another unique vision, that of a group of heroes embarking on a journey of discovery—a metaphorical quest to transform learning. As a guide, we used the book The Hero's Journey by J. Brown and C. Moffett to illuminate our path. The hero's journey follows a cyclical, spiral path of growth involving search, companionship, chaos, complexity, discovery, persistence, initiations, and finally insight and transformation before the journey begins anew. Two principles of a heroic school (excerpted from the book) that mesh well with our vision of collaboration are as follows:

    • "True learning comes from a fusion of head, heart, and body."
    • "Learning occurs in heroic environments in which motivation is largely intrinsic rather than extrinsic."

    With those details in mind, I framed our nascent collaboration efforts to my colleagues as:

    COLLABORATION = Teachers as Scholars who are Courageously Committed to a Hero's Journey

    In a profession that has been coming under increasing external attack from all sides, I think it is important for teachers to give themselves permission to be heroes and to engage as scholars. I think it is imperative that teachers find and leverage their own intrinsic heroism to elevate the teaching profession. I think it is critical that teachers honor, value, practice, and model lifelong learning in an effort to transform education.

    As we had various discussions last year about teacher collaboration time, I captured and saved notes that spoke to our vision. I did not want this vision to get lost and forgotten among the myriad details. Distilling these notes led to the following beautiful and inspiring word cloud about our collaborative vision:


    Buried among all the noisy details, our original vision of collaboration re-emerged: Collaboration is a time and opportunity for teachers to engage in scholarly conversations around curriculum, planning, interventions, and equity.

    I look forward to beginning a fresh hero's journey during our collaboration time this year.

    Sunday, August 7, 2011

    Student Supply Center

    Image credit: Morgue File
    Back to school time has arrived and I will be setting up my classroom this week. One of the most important and useful parts of my classroom is the student supply center. This is a small area in my room where students can help themselves to minor supplies without needing to ask me. I created this supply area well over ten years ago because I simply got tired of being asked a thousand times a day for paper, scissors, pencils, etc. Now all of these things are front and center for students to borrow when they need them and without asking.

    My supply center has the following self-serve items:

    • small plastic boxes of: colored pencils, leftover pencils and pens, scissors, glue, rulers
    • lost and found box (which always seems to fill up too quickly)
    • calendar
    • absent box with handouts for students who were absent and "If You Were Absent" guidelines
    • bathroom occupancy flip sign (occupied/vacant) with "Bathroom" guidelines
    • dictionary/thesaurus
    • scrap/recycle paper
    • table of contents showing our list of assignments
    • box of tissues
    • three-hole-punch

    Small efficiencies like these can reap huge benefits—minimizing wasted time and stress in our very busy classrooms as well as placing additional responsibility in the hands of students to be independent problem solvers.

    Monday, August 1, 2011

    Understanding Science

    A few years back, each teacher at my school was asked to create an artistic puzzle piece that visually reflected her or his values and beliefs. The dozens of linked puzzle pieces are still on display in our school lobby and make an impressive statement about our staff. Number one on my puzzle piece is "scientific literacy and integrity."

    With all of the attacks on the scientific community from various "denier" groups, I worry about the state of scientific literacy in the United States. I fear that too many people are scientifically illiterate and that their illiteracy is being leveraged against them. I want my students to be scientifically literate so that they can make intelligent, informed choices in their lives and not be misled by faulty evidence or illogic.

    Understanding Science is an excellent, comprehensive resource for learning about and promoting scientific literacy. Produced by the UC Museum of Paleontology at the University of California at Berkeley, Its mission "is to provide a fun, accessible, and free resource that accurately communicates what science is and how it really works." With a variety of tools, resources, and lessons that span the K through 16 classroom, Understanding Science showcases the process of science.

    I'd like to highlight two of my favorite resources from Understanding Science:
    How Science Works flowchart from Understanding Science
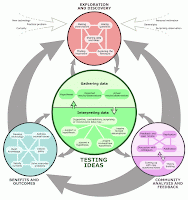
    1. The How Science Works flowchart is an interactive, graphical representation of the process of science and scientific inquiry. I provide a copy of this flowchart to each of my students and use it to frame all of our discussions and activities. Students begin to understand more deeply that science does not happen in a vacuum, that it follows a logical, iterative process, and that it is an ongoing and ever-changing endeavor.
    2. Asteroids and Dinosaurs is a lesson that nicely illustrates "how science works." Tracing the story of Luis and Walter Alvarez, Asteroids and Dinosaurs tell the incredible tale of the work involved in developing the link between asteroid impact and dinosaur extinction. It makes for a great beginning-of-year lesson on the nature of science that can be referenced time and again throughout the school year. 
    As a scientist and a science teacher, I feel it is imperative that we teach students how to be scientifically literate. While I don't expect all of my students to become scientists, I want them to enter the "real world" empowered with the critical thinking skills that are valued in science—many of which I see lacking in today's adults.

    A favorite quote of mine from astrophysicist Neil deGrasse Tyson sums it up well: "If you're scientifically literate, the world looks very different to you, and that understanding empowers you."