When studying the water cycle, three basic questions frame our learning:
- Where is all the water?
- How is the water distributed across planet Earth?
- How does the water move through the Earth system?
Last week's
post described data about global water distribution and techniques for graphing this data. The majority of water on planet Earth is contained in the oceans, bays, and seas (96.5%) with the rest of the water distributed (as either solid, liquid, or gas) among various fresh and saline reservoirs. Very little water is actually readily available for human use—an interesting point to discuss with students.
Water moves from reservoir to reservoir via various processes. There are numerous water cycle videos out there showing how water cycles around the planet. Almost any of these are good for helping students learn the basic terminology associated with the water cycle and visualizing how water moves. To take the learning deeper and go beyond simple rote memorization, I add a few more pieces to the water cycle puzzle.
Water Cycle Simulation Tank
Materials and ingredients:
- an aquarium tank
- wooden blocks
- various rocks and pebbles
- greenery (a few cuttings from house plants)
- water (of course)
- two thermometers
- extra wide roll of aluminum foil
- a glue gun
- tape
- two nested, quart-sized plastic zipper bags
- ice
- a pie plate
- an adjustable lamp
Recipe:
- Set up the aquarium on a stable surface using wooden blocks underneath one end to angle the aquarium.
- Arrange the rocks and pebbles to represent land on the higher side of the aquarium and tuck in the greenery.
- Add a liter or so of water to the lower end to simulate the ocean.
- Place the two thermometers inside the tank, one on the land, one in the sea.
- Prepare two layers of aluminum foil for covering the aquarium, and add several dots from the glue gun to the underside of the aluminum foil that will be covering the land. These dots serve as condensation nuclei for the water vapor that will evaporate from the ocean inside the tank.
- Cover the tank with the foil and seal with tape so that the tank is a closed system.
- Fill the inner plastic bag with ice and seal, and seal the outer bag as well (minimizes leakage). Place the ice bags in a pie pan (a redundant leakage collector) on top of the aluminum foil so that they sit over the land side of the tank. The ice promotes condensation and precipitation.
- Place the lamp on the water side of the tank so that it warms the water and drives evaporation.
- Commence water cycling!
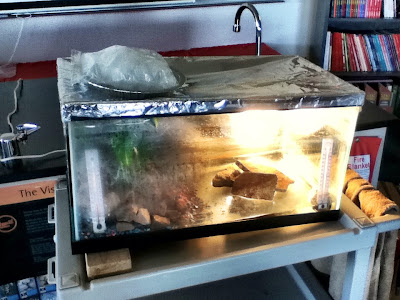 |
| Water Cycle Simulation Tank |
I usually set this up a day ahead of time and allow students to ponder what its purpose is. Soon, I overhear observations about radiation from the lamp, evaporation, condensation, raindrops collecting on the glue drops above the land, precipitation falling onto the leaves of the greenery, etc. Without much prompting other than "What do you think is happening?" students figure out the water cycle process pretty quickly on their own.
Water Cycle Diagrams
Both
NOAA and
USGS have some beautiful water cycle diagrams that can be used to match water cycle vocabulary to water cycle processes. These are good for students to work with during water cycle videos.
Water Cycle Research
Beyond the textbook basics, how do we continue to study the water cycle today? Is it constant or is it changing over time? What tools and technology do we use? To help students better understand current water cycle research, I tap into resources and data visualizations produced by NASA. Here are a few:
- NASA's Earth Observatory has an excellent, detailed discussion of the water cycle from the basics to current observations and research
- NASA's Molecule Max is a whimsical and informative video tutorial on how Earth's water cycle works and how NASA studies it using satellites in space
- NASA's Science Visualization Studio produces a number of high-resolution, global animations of various components of the water cycle
The water cycle is more than just a bunch of memorizable vocabulary terms. It is a dynamic Earth system process worthy of in-depth study and appreciation, especially as natural and anthropogenic forces strain and threaten our precious water resources.


